

The Permission Slip and the Power: FERC Docket RM26-4-000, Large-Load Interconnection, and the Physical Limits of Grid Adaptation
A working paper on the June 2026 reform of large-load interconnection in the United States, with the PJM Interconnection as a case study.

Abstract. On June 18, 2026, the Federal Energy Regulatory Commission (FERC) acted on Docket RM26-4-000 to establish, for the first time, a standardized federal framework for interconnecting very large electricity consumers — data centers above all — to the interstate transmission system. The proceeding originated in an October 2025 directive from the Secretary of Energy under Section 403 of the Department of Energy Organization Act, and was paralleled by a December 2025 order (193 FERC ¶ 61,217) compelling the PJM Interconnection to create new tariff services for co-located load. Together these actions compress and standardize interconnection study procedures, formalize the co-location of load with on-site generation, and propose to assign the full cost of network upgrades to the connecting load. This paper situates the reform within the institutional architecture of U.S. transmission and tests a single proposition: that interconnection procedure is not the binding constraint on the rate at which firm, interconnected electrical load can be added, but rather a comparatively minor term in a system governed by physical manufacturing, transmission construction, generation adequacy, and capital-allocation constraints. Using PJM — the regional grid hosting the densest concentration of data-center load in North America — and drawing on interconnection-queue census data, three years of capacity-auction results, the North American Electric Reliability Corporation's reliability assessment, equipment lead-time surveys, and the FERC primary docket, we decompose the speed-to-power problem and quantify each constraint. We find that the procedural stage the reform targets occupies the shortest segment of a five-to-seven-year critical path; that the reform's most consequential effect is therefore distributional (through cost allocation) rather than temporal; and that the binding constraints — gas-turbine and transformer lead times measured in years, a single domestic source of grain-oriented electrical steel, and a capacity market that has now cleared below its reliability requirement for the first time in its history — lie almost entirely outside the reform's reach. The reform is necessary; it is not, by itself, sufficient.
Keywords: electricity markets; transmission interconnection; data centers; capacity markets; cost allocation; resource adequacy; PJM; FERC. JEL classification: L94, Q41, Q48, L51, K23.
1. Introduction
1.1 An electricity-demand shock without modern precedent
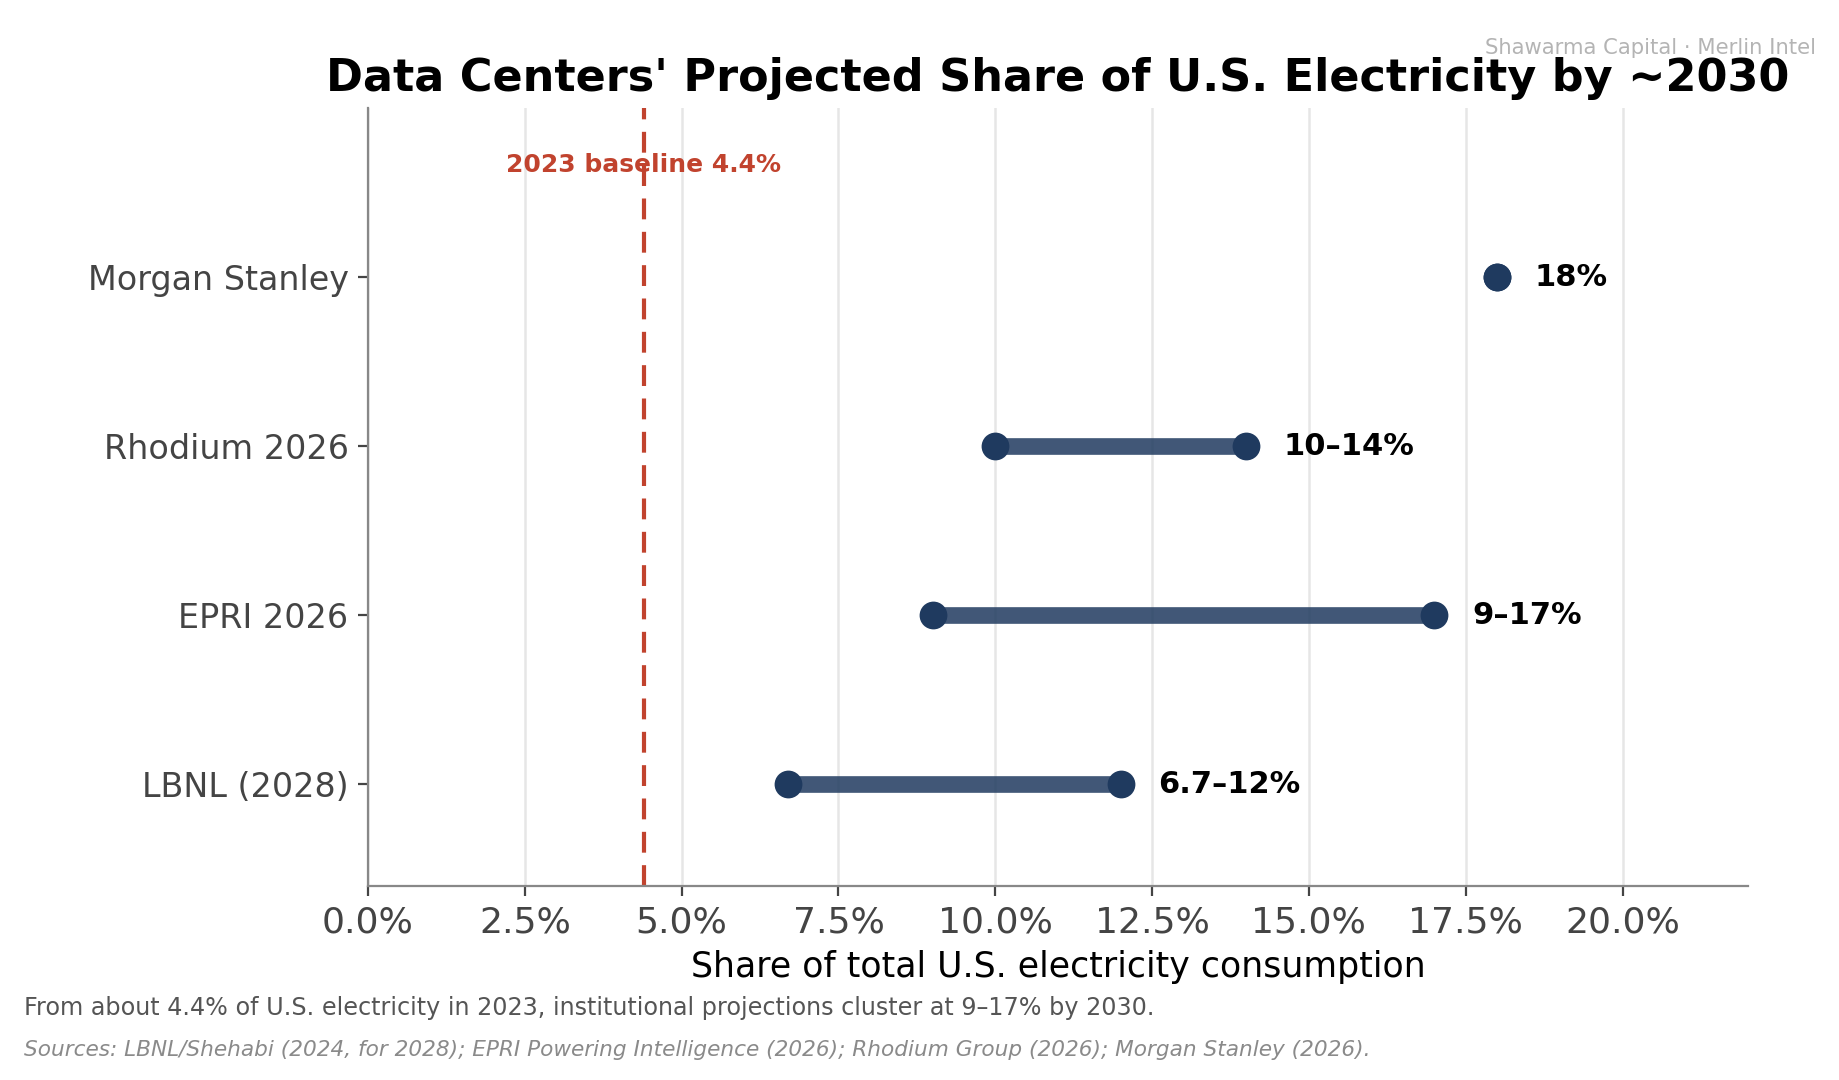
For roughly two decades, U.S. electricity consumption was essentially flat; utilities planned around demand growth of well under one percent per year. That regime has ended, and the proximate cause is computation. Lawrence Berkeley National Laboratory's congressionally-mandated assessment documents U.S. data-center electricity consumption rising from 58 terawatt-hours (TWh) in 2014 to 176 TWh in 2023 — 4.4% of national consumption — and projects 325 to 580 TWh by 2028, or 6.7% to 12% of all U.S. electricity (Shehabi et al., LBNL, 2024). The Electric Power Research Institute's 2026 scenarios place the 2030 figure higher still, at 9% to 17% (EPRI, 2026). On a global basis, the International Energy Agency estimates data-center consumption growing from about 415 TWh in 2024 to roughly 945 TWh by 2030 — a doubling — and notes that by 2035 U.S. data centers alone will consume more electricity than the production of aluminum, steel, cement, and chemicals combined (IEA, Energy and AI, 2025).
The defining feature of this load is not only its magnitude but its velocity. An artificial-intelligence training campus is conceived, financed, and brought toward commissioning on a horizon of eighteen to thirty months, while the transmission system that must serve it is planned, permitted, and built over five to ten years. The mismatch between the clock speed of compute and the clock speed of the grid is the organizing tension of contemporary U.S. electricity policy, and it is the problem to which Docket RM26-4-000 is addressed.
1.2 The policy response
On October 23, 2025, Secretary of Energy Chris Wright invoked Section 403 of the DOE Organization Act — a seldom-used authority permitting the Secretary to direct FERC to consider a rulemaking — to instruct the Commission to ensure "the timely and orderly interconnection of large loads to the transmission system," citing AI data centers as an "urgent issue." FERC transmitted the resulting Advance Notice of Proposed Rulemaking (ANOPR) on October 27, 2025 (Accession 20251027-3056), opening Docket RM26-4-000. More than 3,500 pages of comments followed. On April 16, 2026, FERC issued a procedural "Order Regarding Intent to Act," committing to a final action by the end of June 2026 in a manner "quick, efficient, and legally durable," and on June 18, 2026, the Commission took up the matter as Agenda Item E-1.
In parallel, on December 18, 2025, FERC issued a unanimous order — PJM Interconnection, L.L.C., 193 FERC ¶ 61,217 (2025) — finding PJM's tariff "unjust and unreasonable" for lacking clear terms for co-located load, and directing the creation of three new transmission-service constructs. The political framing of both actions is straightforward: regulatory friction is the obstacle to powering the AI build-out, and removing it will unlock supply.
1.3 Thesis and contributions
This paper subjects that framing to scrutiny. Our central proposition is that the procedural reforms, although sound and overdue, operate on the least binding constraint in the speed-to-power system. We make five contributions. First, we provide an integrated account of the reform and its institutional antecedents (Sections 2–3). Second, we develop a constraint-decomposition framework that locates interconnection procedure within a broader critical path (Section 4). Third, we assemble the empirical record — queue economics, demand projections, the PJM case study, and the equipment supply chain — and quantify each constraint (Sections 5–6, 9). Fourth, we analyze the distributional economics of participant funding, which we argue is the reform's most consequential feature (Section 8). Fifth, we develop scenarios and a research agenda (Sections 11–12). The analysis is positive rather than prescriptive, and deliberately avoids security-specific or investment recommendations.
1.4 Roadmap
Section 2 establishes the institutional background. Section 3 details the reform and its primary record. Section 4 develops the conceptual framework. Section 5 presents the queue evidence. Section 6 is the PJM case study. Section 7 addresses co-location and the Susquehanna precedent. Section 8 analyzes cost allocation. Section 9 examines generation adequacy and the supply chain. Section 10 synthesizes; Section 11 offers scenarios and sensitivity; Sections 12 and 13 address limitations and conclude. An appendix provides a glossary and methodology note.
2. Institutional Background: The Architecture of Interconnection
2.1 Generators, loads, and the pro forma agreement
Across roughly two-thirds of the United States, the bulk power system is administered by independent system operators and regional transmission organizations (ISOs/RTOs) operating under FERC-jurisdictional tariffs. Historically, interconnection reform has concentrated on generators: a power plant seeking to inject energy executes an interconnection service agreement (ISA) whose terms derive from a federal pro forma standard established in Order No. 2003 (2003). Agreements that deviate from that pro forma — "non-conforming" agreements — bear a high justificatory burden, requiring demonstration of reliability concerns, novel legal issues, or unique operational factors. This doctrinal point, seemingly technical, becomes decisive in the co-location analysis of Section 7.
2.2 Order No. 2023 and the generator queue
By the early 2020s, generator interconnection queues had become severely congested, dominated by speculative renewable and storage projects. FERC's Order No. 2023 (2023) responded by replacing the serial, "first-come, first-served" study process with a "first-ready, first-served" cluster-study approach, imposing commercial-readiness deposits and study deadlines to deter non-viable applications. Crucially for the present analysis, Order No. 2023 reformed the generator queue. It did not establish a comparable national framework for large loads, which had long been treated under the retail jurisdiction of states and the bespoke practices of individual utilities.
2.3 The procedural gap and the jurisdictional question
It is precisely this gap that RM26-4-000 targets. A hyperscale data center is, electrically, a large load rather than a generator; yet a 500 MW load can stress a transmission network as severely as a 500 MW plant. In the absence of a standardized federal large-load interconnection process, treatment varied by jurisdiction, producing uncertainty, litigation risk, and delay. Filling the gap, however, raises a contested legal question that runs through the entire proceeding: whether FERC possesses jurisdiction over load interconnection at all. The Department of Energy argues that the Federal Power Act, Section 201(b) — governing wholesale transmission access and practices "directly affecting" wholesale rates — supplies the authority; states and many utilities counter that load interconnection is a retail matter reserved to them (American Bar Association, 2026). As we discuss in Section 3, FERC's parallel PJM order suggests a strategy designed to sidestep, rather than resolve, this collision.
3. The Reform in Detail
3.1 Provenance and the six principles
RM26-4-000 originated not in an industry petition but in the Secretary of Energy's October 2025 directive. The ANOPR set out six reform principles (Mayer Brown, 2025; CSIS, 2025):
Standardized study deposits, readiness requirements, and withdrawal penalties, modeled on the generator-interconnection discipline of Order No. 2023, together with an "option to build" network upgrades;
A joint study process for hybrid facilities that co-locate load with generation;
System Support Resource / Reliability-Must-Run (SSR/RMR) studies when a large load co-locates with an existing generator, to capture the reliability consequences of diverting that generator's output;
An expedited interconnection study — potentially 60 days — for curtailable or dispatchable loads, an explicit reward for flexibility;
One hundred percent participant funding, under which the large load bears all assigned network-upgrade costs; and
Transition planning for projects already in study.
3.2 The 20 MW threshold and the federalism problem
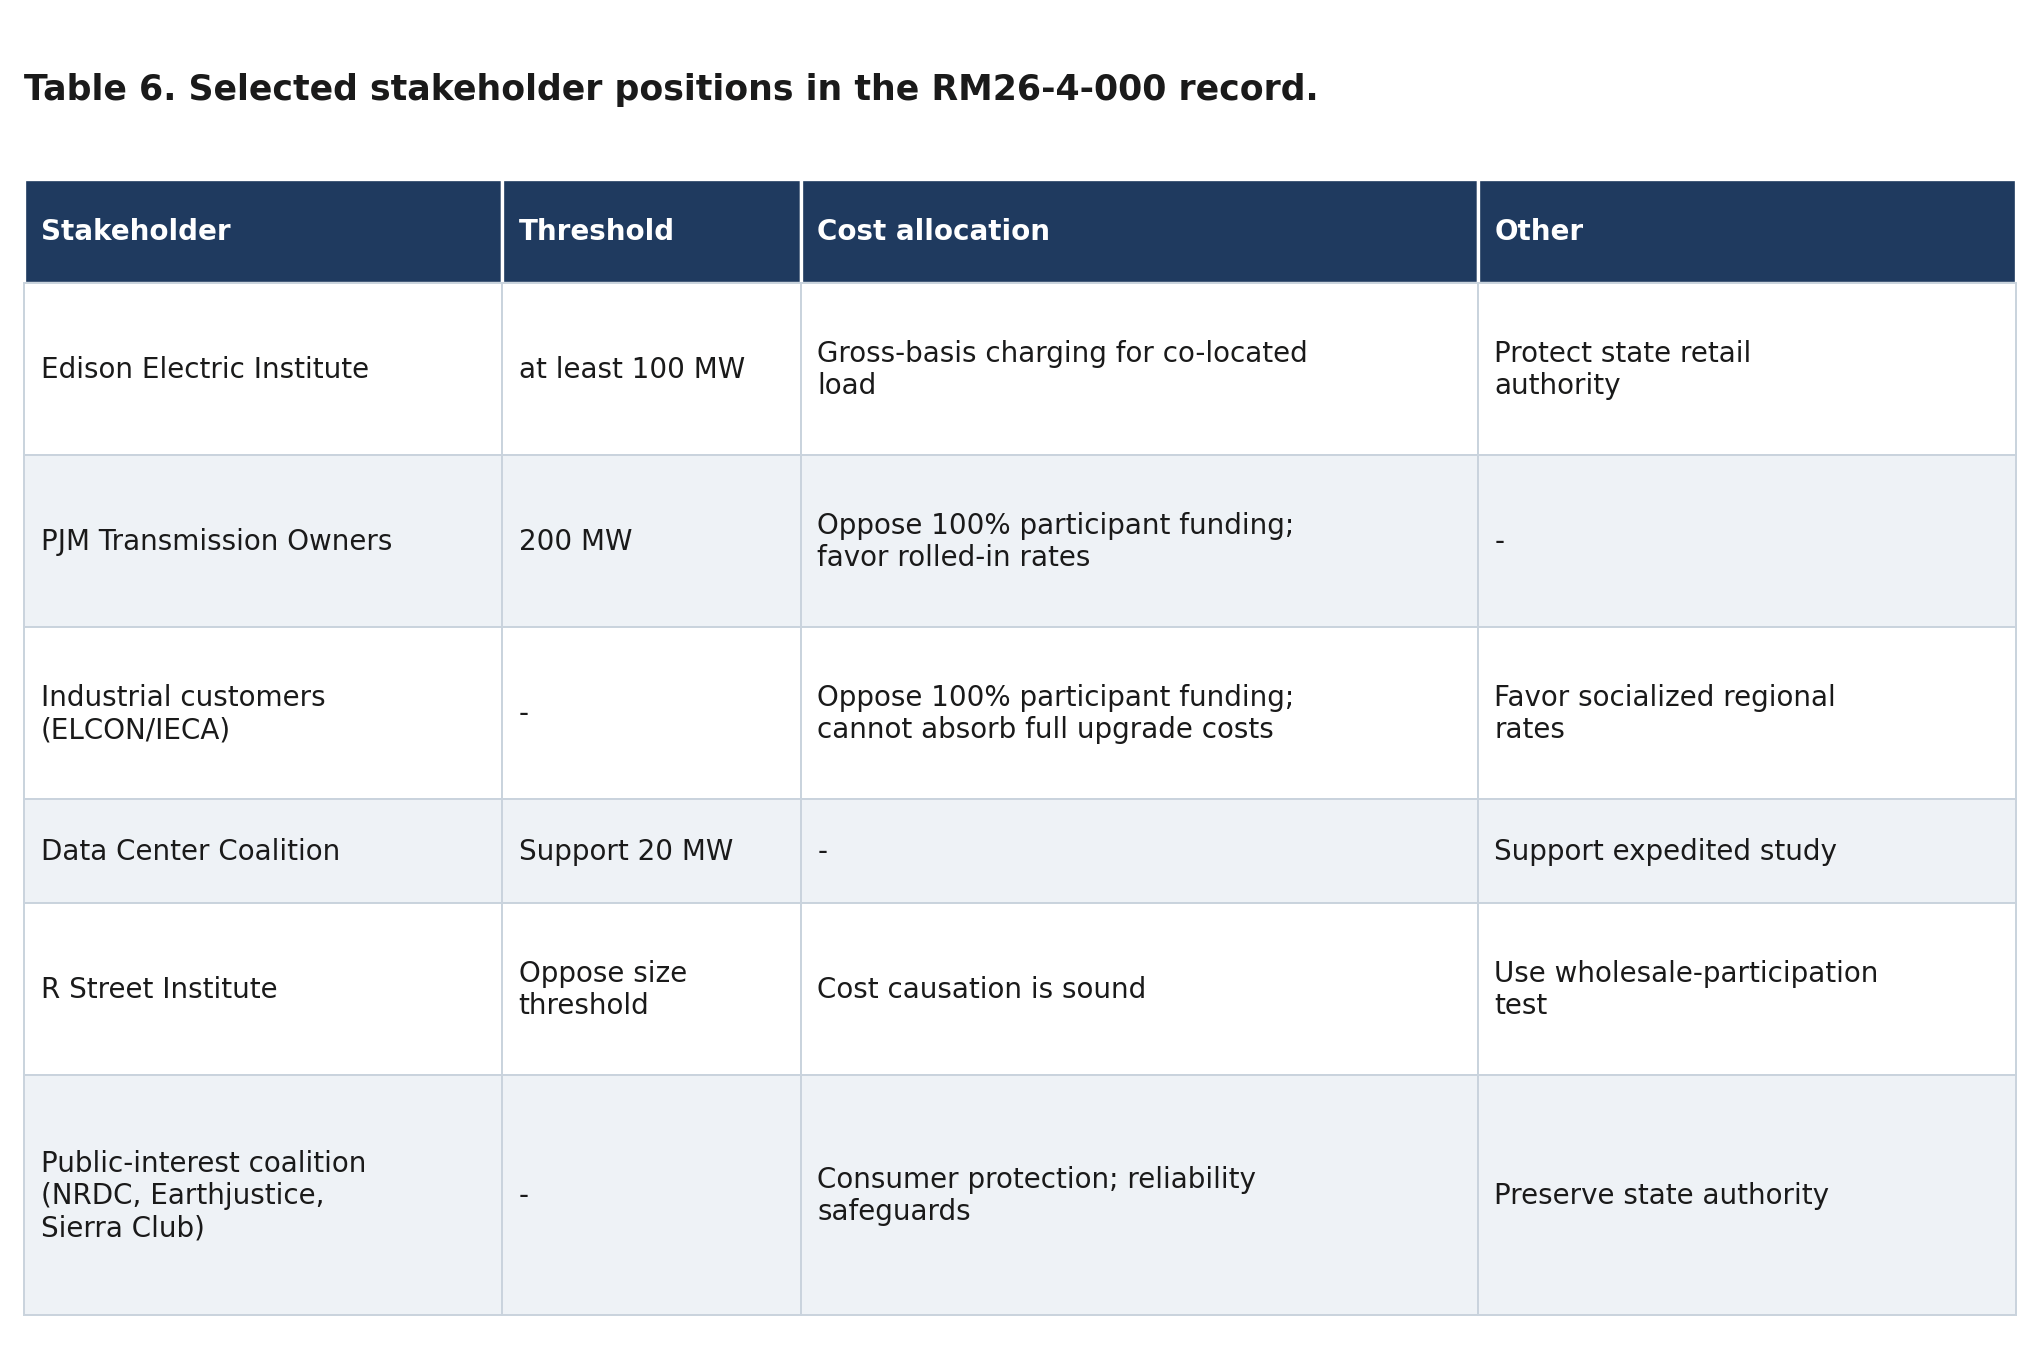
The ANOPR provisionally defines a "large load" as one exceeding 20 MW, while expressly soliciting comment on whether that threshold is appropriate or should be eliminated. The figure is contested precisely because it is low: hyperscale facilities routinely exceed several hundred megawatts, so a 20 MW floor could "sweep in mid-sized manufacturers and facilities traditionally served under state tariffs, effectively federalizing retail matters" (CSIS, 2025). The comment record fractured along this line (Table 6): the Edison Electric Institute urged a floor of at least 100 MW; PJM's transmission owners argued for 200 MW; the R Street Institute opposed a size threshold entirely, proposing instead a test based on wholesale-market participation; and the Data Center Coalition supported the 20 MW figure and the expedited timelines.
3.3 Participant funding and cost causation
The reform's economic core is the 100% participant-funding model: the connecting large load pays the full cost of the network upgrades its interconnection triggers, on a cost-causation rationale. We analyze the welfare properties of this choice in Section 8; here we note only that it is a significant departure from the prevailing treatment of transmission as shared infrastructure recovered through regional rates — a structure under which, by one leading estimate, more than 90% of U.S. transmission investment is presently socialized rather than assigned to specific beneficiaries (Pfeifenberger / Brattle Group, 2024).
3.4 The PJM co-location order (193 FERC ¶ 61,217)
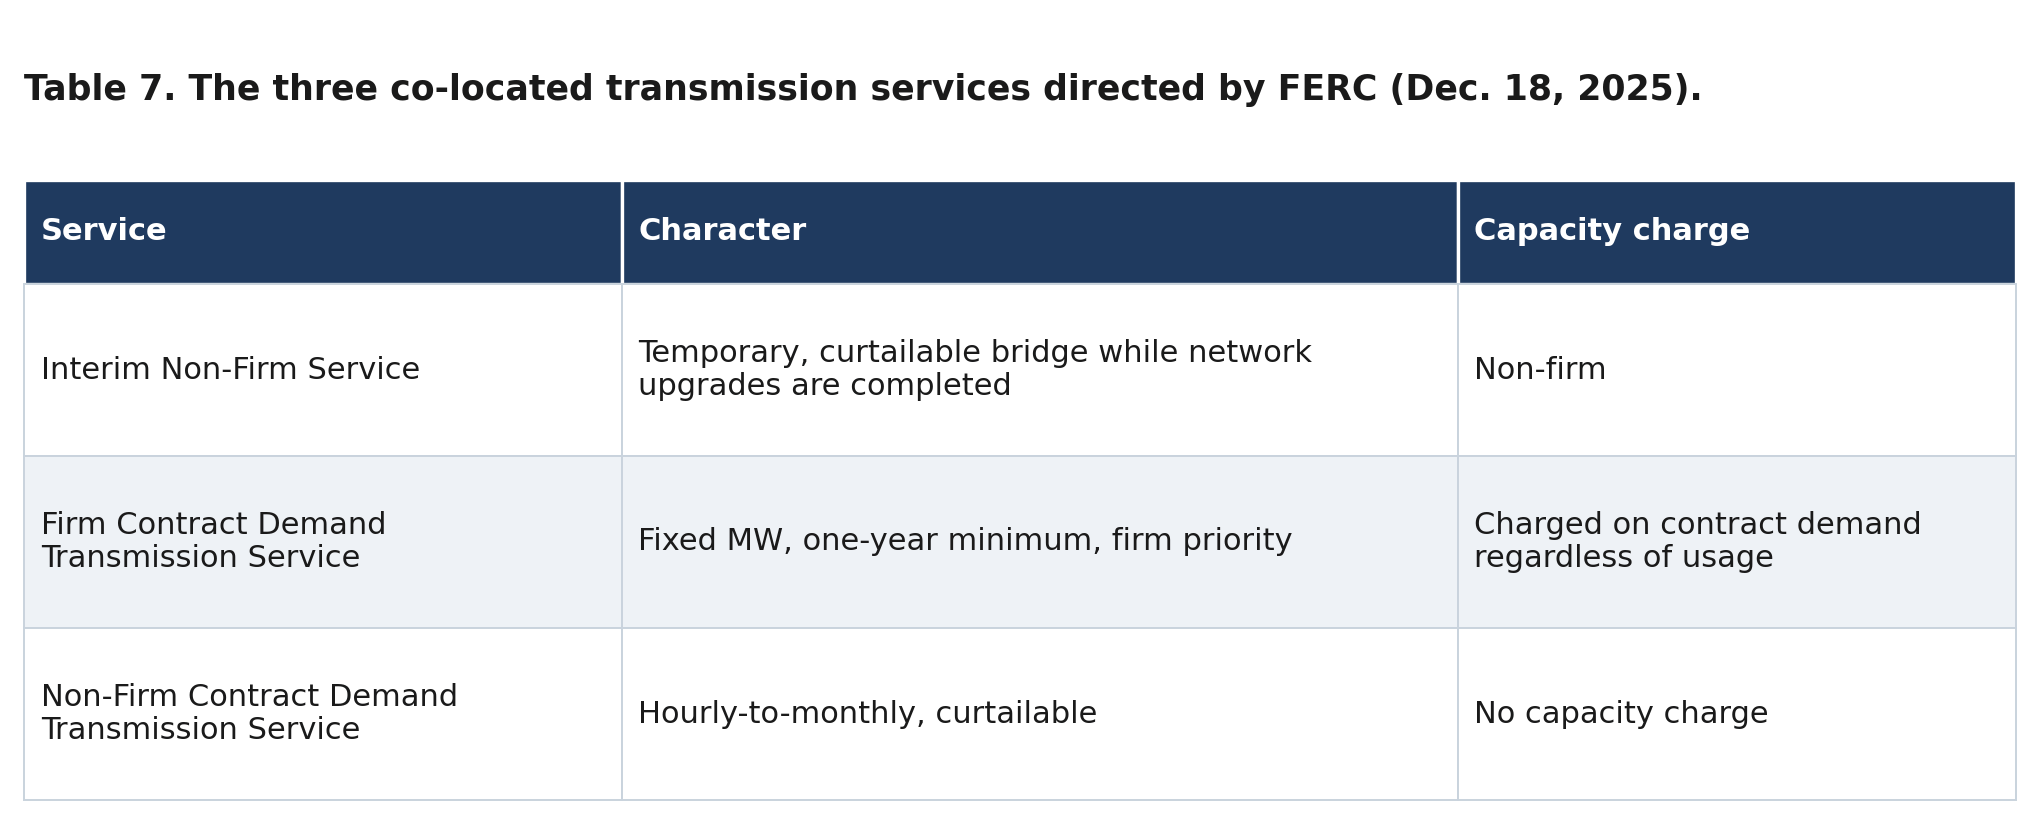
The December 2025 order is the reform's operational vanguard within PJM. Finding the PJM tariff "unjust and unreasonable" for lacking "clear rates, terms, and conditions of service" for co-located loads — a deficiency that produced "uncertainty" and "disparate treatment" — FERC directed PJM to create three new transmission-service constructs (Table 7) and to reform behind-the-meter generation (BTMG) rules it likewise found no longer just and reasonable, imposing a three-year transition, a materiality threshold, and grandfathering of existing contracts. Co-located loads must pay for Regulation and Black Start service on a gross demand basis, addressing the cost-shifting concern directly. Compliance filings were ordered for January 17 and February 16, 2026.
Chairman Laura Swett framed the order's animating purpose in consumer terms — "I don't want any American family to feel that anxiety because of anything that we do" — while Commissioner Judy Chang observed that "the broader challenge of reliably, efficiently, and fairly interconnecting large loads … remains before the Commission, the States, and industry." Commissioner Rosner's concurrence is analytically telling: it described the order as achieving "the ANOPR's goals without jurisdictional confrontation." This suggests that FERC's preferred strategy is to accomplish large-load reform through its unambiguous authority over wholesale transmission-service tariffs, rather than by asserting the legally novel and contested jurisdiction over retail load interconnection discussed in Section 2.3.
3.5 The June 18, 2026 action
At its June 18, 2026 open meeting, FERC acted on RM26-4-000 (Agenda Item E-1), advancing the large-load framework consistent with the ANOPR record — standardized study procedures, co-location pathways, an expedited-study incentive for curtailable load, and the participant-funding principle. Consistent with the Rosner concurrence, the instrument is best read as grounded in FERC's wholesale-service authority, preserving legal durability at the cost of comprehensive coverage of loads that never participate in wholesale markets. (The precise instrument — a notice of proposed rulemaking advancing toward a final rule, versus a direct final rule — and its operative provisions should be confirmed against the issued order; pre-meeting materials did not definitively resolve the instrument type.)
4. Conceptual Framework: Decomposing Speed-to-Power
4.1 The interconnection timeline as a critical path
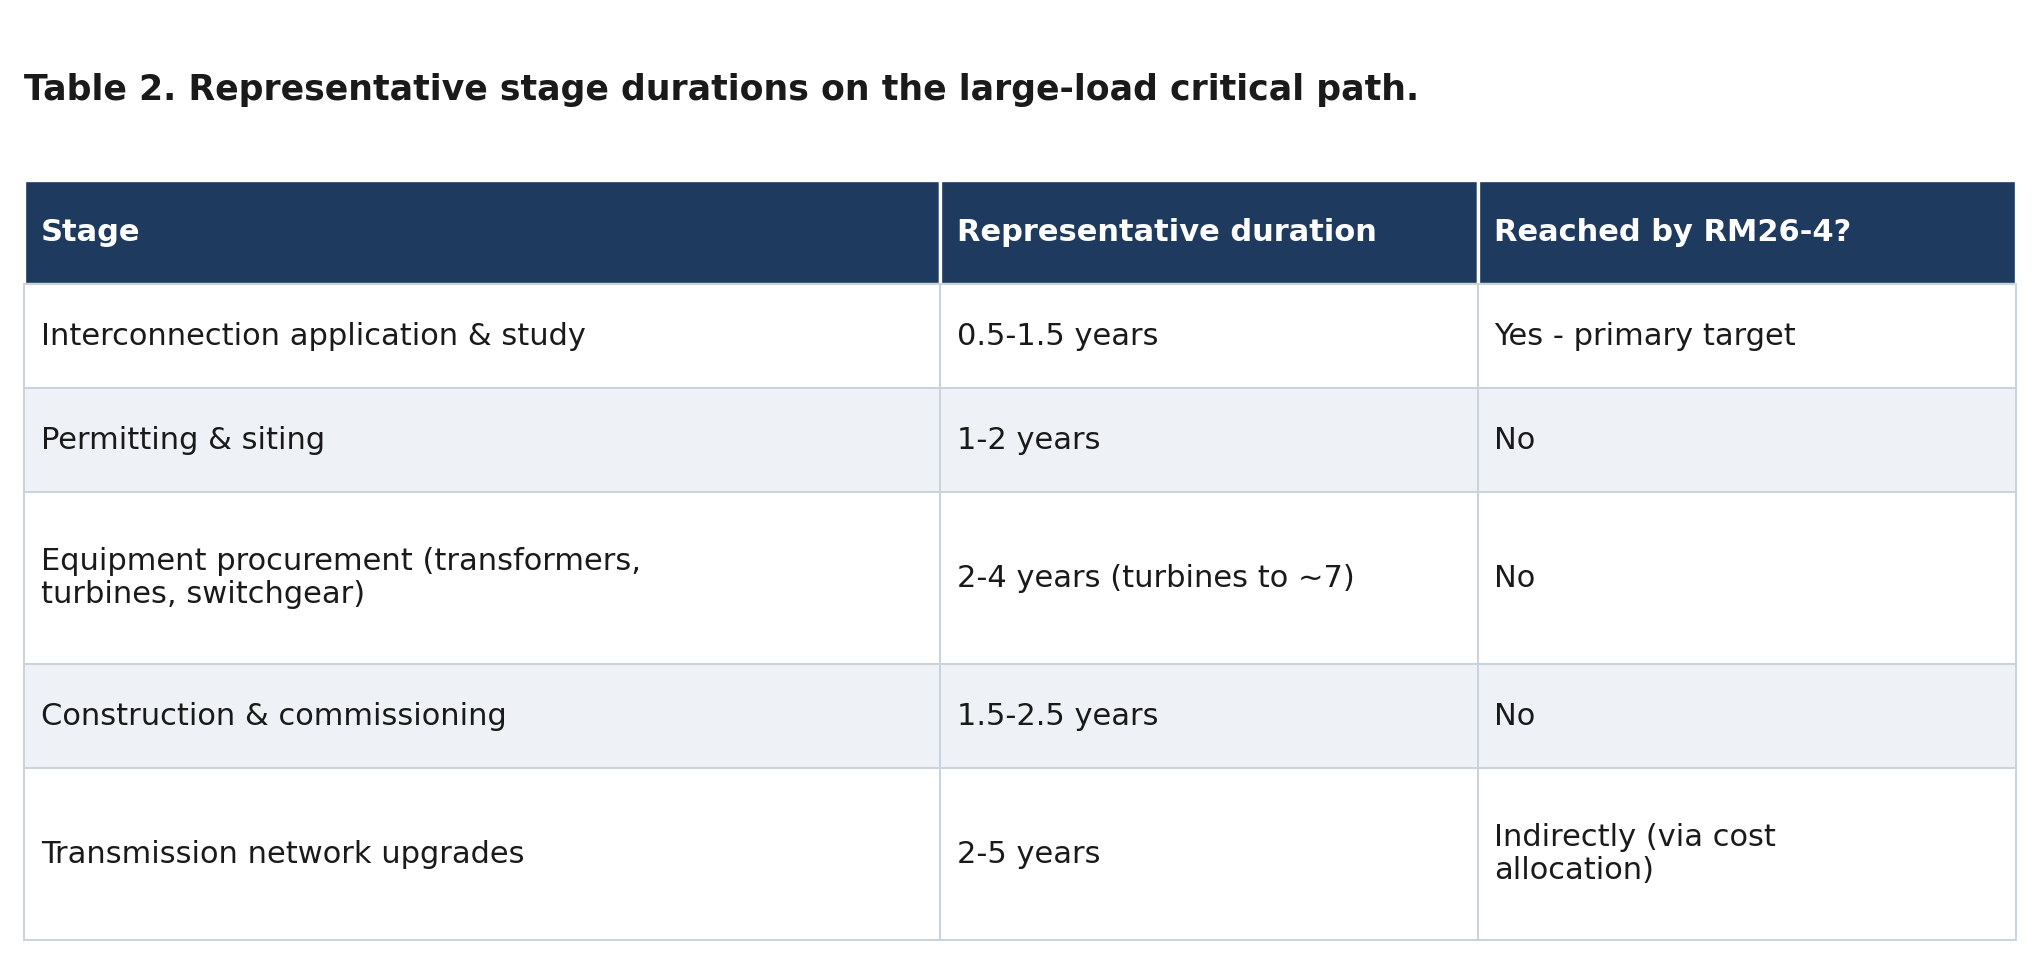
We model the interval from a developer's decision to build to energization at scale as a critical path of partially overlapping stages. For a greenfield large load — or the generation that must accompany it — this interval typically spans five to seven years. Table 2 decomposes it and identifies which stages the reform reaches.
4.2 A taxonomy of constraints
It is useful to classify the constraints on speed-to-power into five categories. Procedural constraints are study queues and agreement execution. Physical constraints are the manufacturing and construction of transformers, turbines, and transmission lines. Supply-chain constraints are the upstream inputs — grain-oriented electrical steel, high-voltage bushings, skilled labor. Capital constraints are the financing and cost-allocation terms that determine whether a project proceeds. Reliability constraints are the engineering limits planners impose to keep the system stable. RM26-4-000 operates almost entirely on the procedural constraint, with a secondary effect on the capital constraint through cost allocation. It does not touch the physical or supply-chain constraints, and it bears on reliability only insofar as the expedited-study incentive presumes a flexibility that, as Section 7 shows, large loads have been reluctant to provide.
4.3 The marginal value of relaxing the procedural constraint
The policy-relevant quantity is the marginal reduction in total elapsed time from relaxing the procedural constraint while the others bind. If the procedural stage is the shortest element of the critical path — and Table 2 indicates it is — then compressing it yields a correspondingly small reduction in total time. The intuition is captured in the practitioner observation that the regulatory delay amounts to "a three-to-six-month edit on a five-to-seven-year wait": grid connections take years not because approvals take years, but because the manufacturing and construction of physical assets does. Figure 4 visualizes this asymmetry.
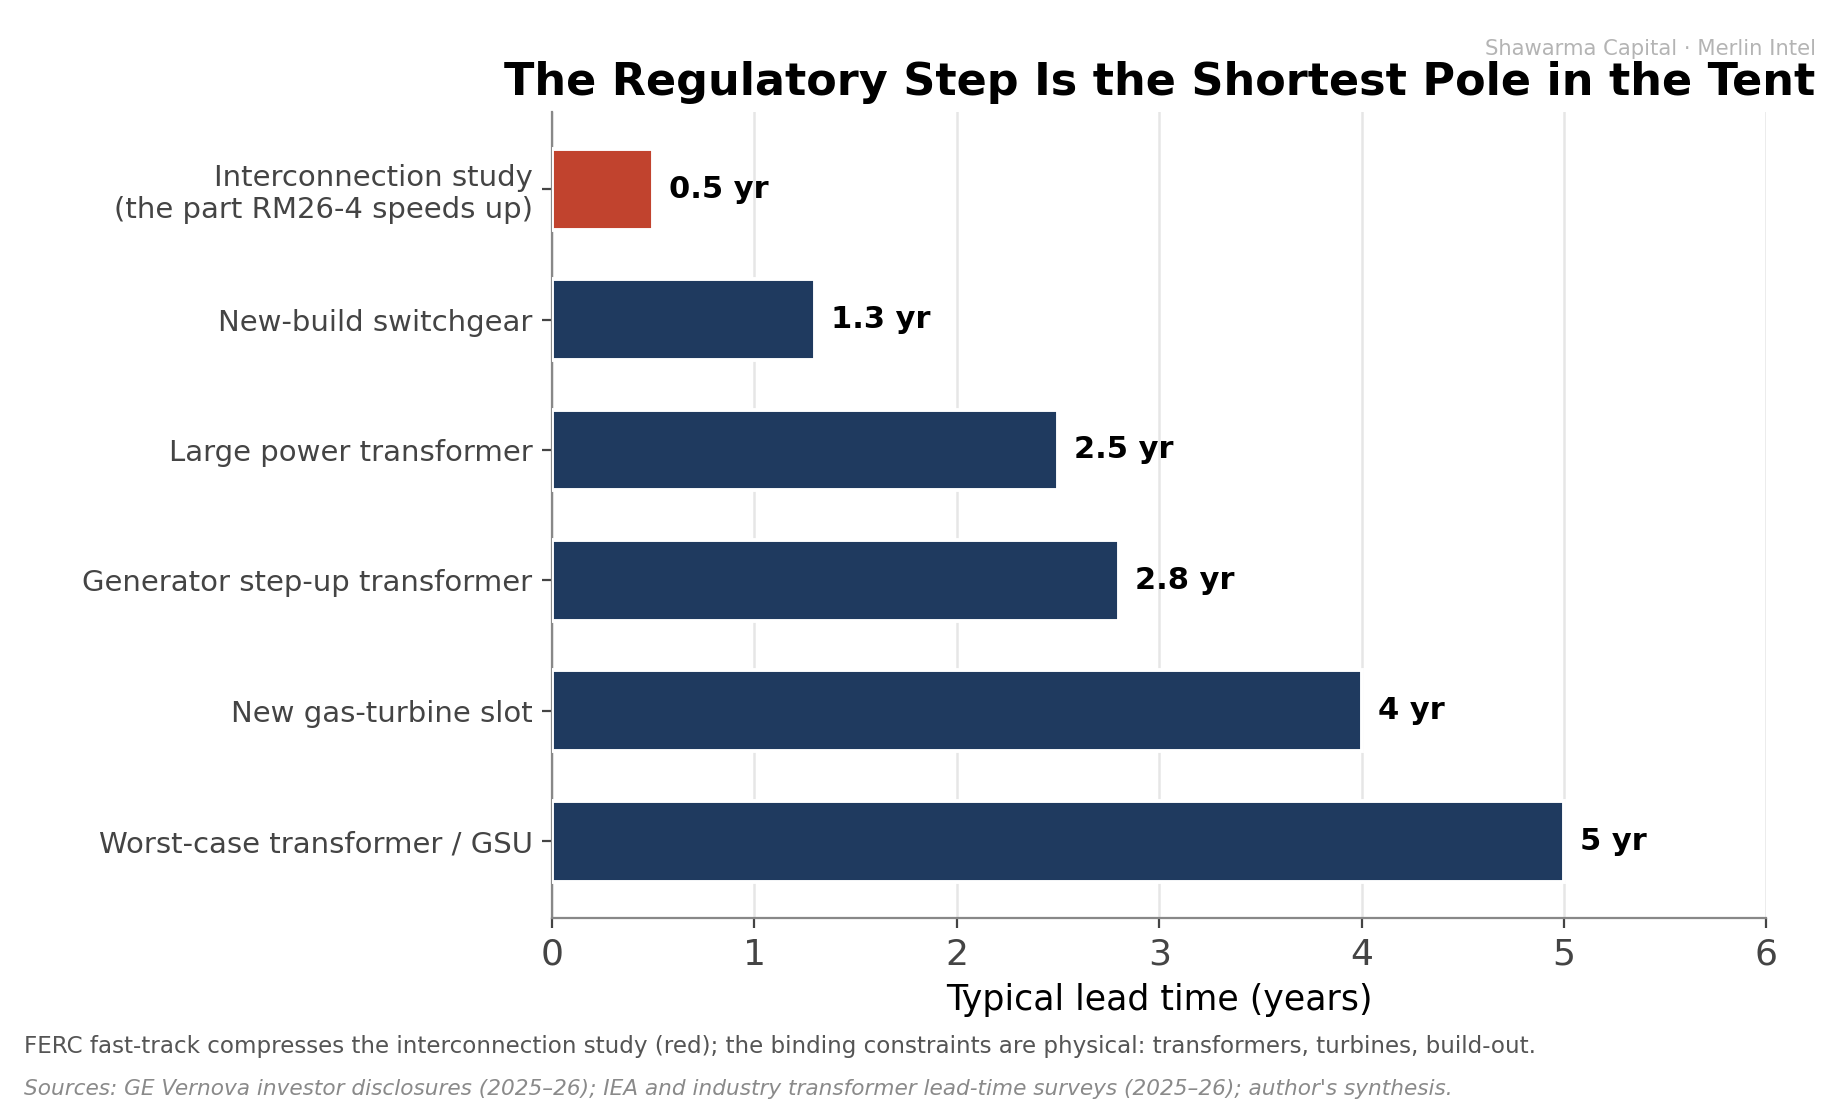
This is not an argument against the reform. Removing a discretionary, variable, and litigation-prone source of delay has genuine value: it improves cost discovery, reduces uncertainty, and materially accelerates the minority of projects for which the procedural stage is on the critical path — most importantly co-located projects that avoid network upgrades entirely (Section 7). The point is narrower and more precise: a reform confined to the procedural stage cannot, by construction, relax the physical and supply-chain constraints that dominate the remaining years of the path.
5. Queue Economics: The Evidence on "Shovel-Ready" Capacity
5.1 The scale of the queues
A recurring claim in public discourse — visible in the response to the very Bloomberg report that frames this paper — is that vast capacity sits "ready to connect." The empirical anchor is Lawrence Berkeley National Laboratory's Queued Up: 2025 Edition, which reports approximately 2,290 GW of generation and storage actively seeking interconnection at the end of 2024 — roughly 1,400 GW of generation plus 890 GW of storage across some 10,300 projects, nearly twice the entire installed U.S. generating fleet (Rand et al., LBNL, 2025). The peer-reviewed treatment in Joule reports a comparable figure of about 2,600 GW against an installed base of roughly 1,280 GW (Gorman et al., 2024). On its face, this supports the abundance narrative.
5.2 Attrition and the "ready to connect" fallacy
The interpretation collapses under the completion data. Of the capacity that requested interconnection between 2000 and 2019, only 13% had reached commercial operation by the end of 2024; approximately 77% had been withdrawn; and 10% remained active (LBNL, 2025). The Joule analysis, spanning more than 38,000 project-level observations, reports a withdrawal rate of roughly 78–80% (Gorman et al., 2024). Far from clearing, the funnel is lengthening: the median time from request to commercial operation for projects that energized in 2024 was 55 months (4.6 years), up from 22 months for the 2008 cohort and 36 months for the 2015 cohort — a near-tripling. And the attrition is not merely early-stage speculation: in 2024 a record 700 GW withdrew — exceeding the roughly 500 GW of new requests — with one-third of withdrawals occurring at the late-stage facility-study or interconnection-agreement phase, after the system had already incurred planning and study costs (LBNL, 2025).
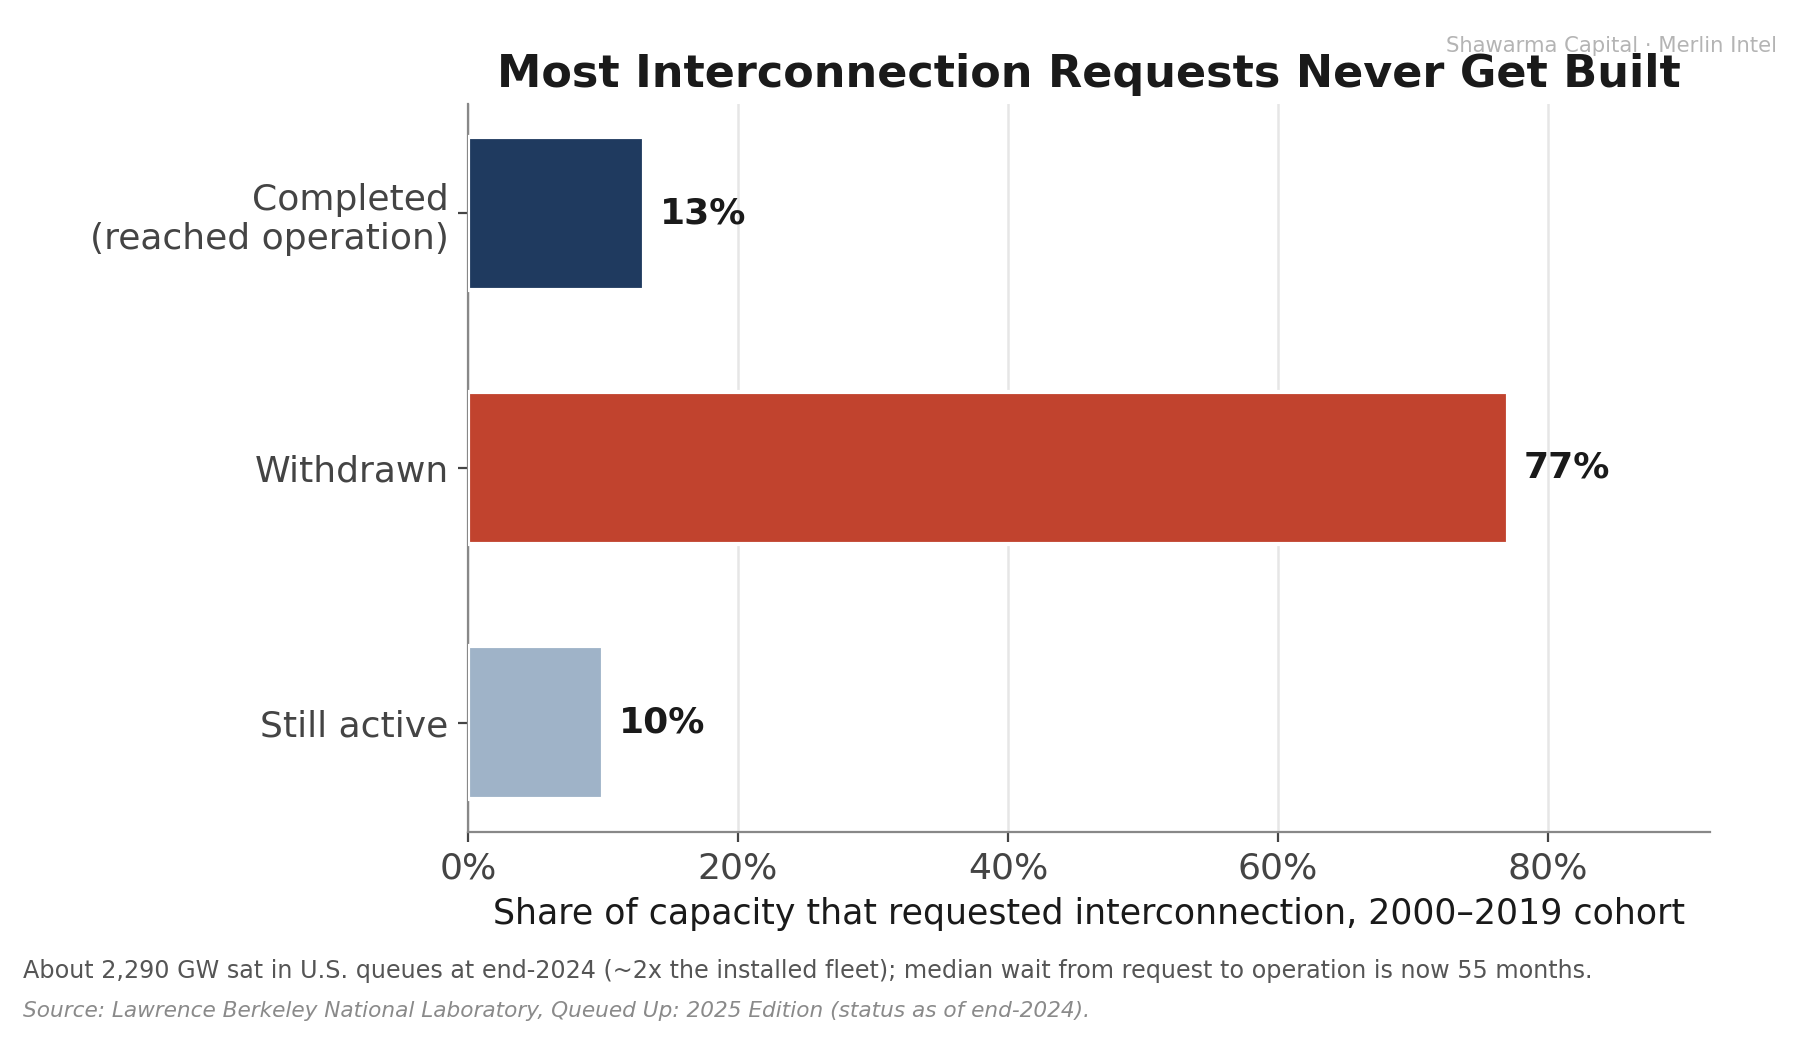
A queue, properly understood, is not an inventory but a funnel with heavy attrition; a project with secured equipment, financing, transmission, and offtake is the exception. The headline gigawatt figure overstates deliverable near-term supply by nearly an order of magnitude once historical completion rates are applied.
5.3 The load–generation distinction
A further subtlety is decisive. The queue census describes generation. Data centers are load, and the large-load interconnection pathway is both procedurally distinct from and far less mature than the generator queue that Order No. 2023 reformed. Extrapolating generator-queue abundance to load-interconnection readiness is therefore a category error. In PJM specifically, the load side is already congested in its own right: the Independent Market Monitor reports more than 3,300 projects awaiting interconnection — the largest backlog of any RTO (Monitoring Analytics, 2025), and PJM's recent cycle drew applications representing roughly 220 GW, of which only about 21 GW had reached engineering/procurement and 8.2 GW were under construction as of January 2026.
6. The PJM Interconnection: A Case Study
6.1 Why PJM
PJM coordinates the bulk power system across thirteen states and the District of Columbia and administers the largest competitive wholesale electricity market in the world. It contains "Data Center Alley" in Northern Virginia, the single densest cluster of data-center load on the continent. PJM therefore offers the sharpest available test of how a grid absorbs concentrated, rapid large-load growth — and, as the data below show, the first system in which the strain has become acute enough to break a previously reliable market mechanism.
6.2 Demand: a forecast dominated by data centers
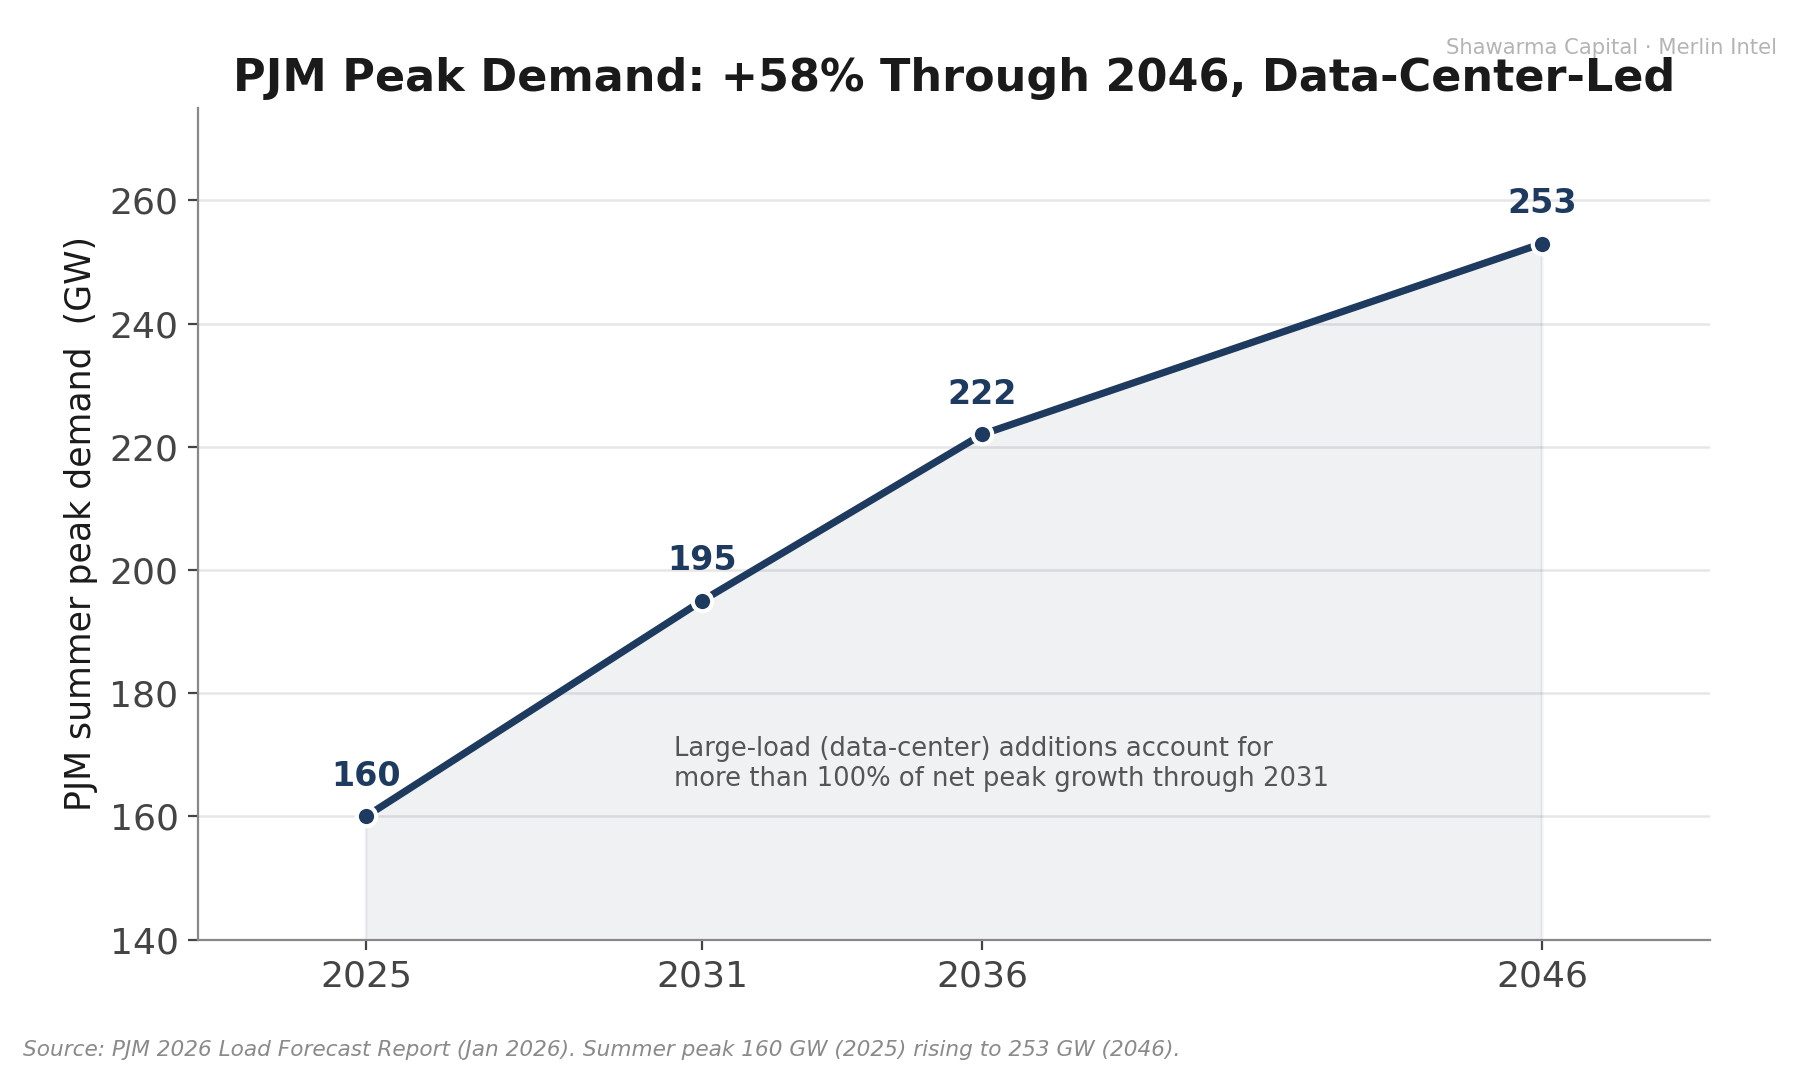
PJM's load forecast has been transformed in three years. The aggregate of utility ten-year demand forecasts for the region rose roughly six-fold, from 24 GW of projected summer growth in 2022 to 166 GW in 2025 (LBNL Large Load Literature Review, 2025). PJM's own 2025 Long-Term Load Forecast projects peak load growth of 32 GW between 2024 and 2030, of which data centers account for approximately 94%; over 2025–2040, data centers represent 422 TWh of a projected 605 TWh of annual load growth — about 70% (PJM, 2025). NERC's reliability assessment, applying a more conservative lens, still projects PJM summer peak rising by 56 GW and winter peak by 62 GW by the mid-2030s (NERC, 2026). The composition is the salient fact: large loads account for essentially all net peak growth, as conventional demand is flat.
It is worth noting that even these figures embed downward corrections. PJM tightened its data-center counting methodology to avoid double-counting speculative or duplicative requests — an admission that "announced" load materially overstates probable load, a theme we return to in Section 11.
6.3 The capacity market and the price signal
PJM secures resource adequacy through a forward capacity market, the Reliability Pricing Model (RPM), whose Base Residual Auction (BRA) procures committed capacity three years ahead. As surging demand projections met a tightening, retiring supply stack, the clearing price escalated across three consecutive auctions, as shown in Figure 1.
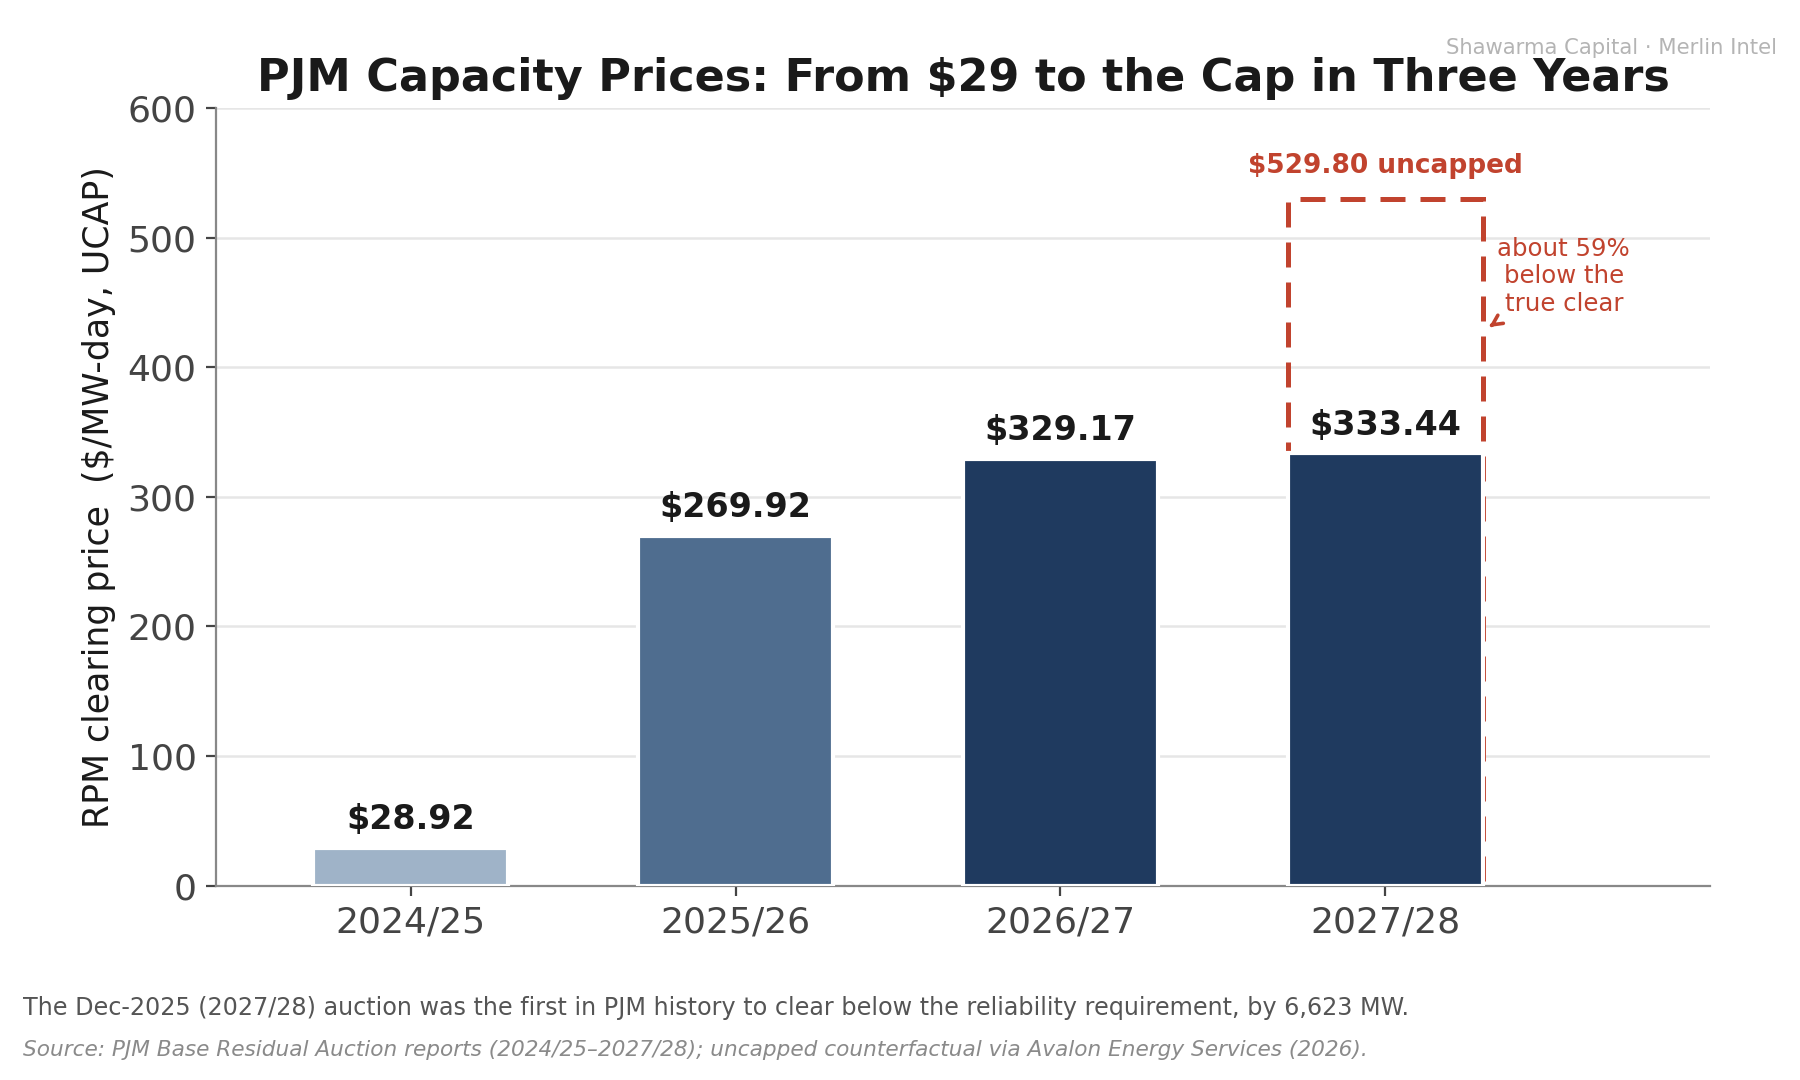
Three features of the 2027/28 auction (held December 17, 2025) deserve emphasis. First, the entire RTO — every locational deliverability area, and even the Fixed Resource Requirement areas — cleared at the price cap of $333.44/MW-day. Second, the auction procured 134,479 MW through the BRA plus 11,299 MW of FRR resources, for 145,777 MW combined, and still fell 6,623 MW short of the one-event-in-ten-years reliability requirement — the first such shortfall in PJM's history, leaving a reserve margin of 14.8% against a 20% target. Third, approximately 5,100 MW of the 5,250 MW year-over-year increase in the demand forecast — about 97% — was attributable to data-center load (PJM, 2025).
6.4 The price cap and the structural trap
The 2027/28 result reflects a price-collar settlement negotiated after Pennsylvania challenged the prior auction at FERC; the floor was set at $179.55/MW-day. A counterfactual simulation indicates the auction would otherwise have cleared at roughly $529.80/MW-day RTO-wide, and $542.83 in the Dominion zone — implying the cap suppressed the price by about 59% (Avalon Energy Services, 2026). This produces a structural trap. The cap was designed as a consumer protection for a market with surplus capacity; it now suppresses the very investment signal needed to close a 6,623 MW shortfall. The Independent Market Monitor has accordingly declared the capacity auctions for the 2025/26, 2026/27, and 2027/28 delivery years "not competitive," "in significant part as a result of forecast demand for data centers" (Monitoring Analytics, 2026). The market is simultaneously pricing scarcity at its ceiling and prevented from pricing it high enough to resolve it.
6.5 Consumer incidence and the wider market
The escalation reaches consumers through both capacity and energy channels. The IMM's 2025 State of the Market report records the full-year real-time locational marginal price rising 50.4%, from $33.74 to $50.73/MWh, and the total cost of wholesale power rising 48.9%, from $55.52 to $82.67/MWh, with the capacity-cost component alone up 262.3% year-over-year (Monitoring Analytics, 2026). Real-time load rose 3.7% in 2025, and PJM set new winter and summer peak records in the same year. These are not abstractions: as Section 8 details, the increases have already produced double-digit monthly bill increases across PJM states and have forced administrative intervention in a market mechanism.
6.6 Reliability and the supply side
NERC's 2026 Long-Term Reliability Assessment classifies PJM at "elevated risk," with the anticipated reserve margin falling below the reference margin level beginning in 2029; the 2026 summer anticipated reserve margin deteriorated from 35.7% in the prior assessment to 29.7% in a single year (NERC, 2026). NERC also revised its ten-year North American summer peak-demand growth forecast upward by 69%, from +132 GW to +224 GW. Notably, the greatest risk of unserved energy in PJM falls in winter, under below-normal temperatures with natural-gas infrastructure constraints — a reminder that resource adequacy is a seasonal and fuel-security problem, not merely a nameplate-capacity problem. An adversarial review argues NERC overstates the risk by excluding likely-to-connect queue resources, and that counting them would resolve most identified shortfalls (Grid Strategies, 2026) — a useful caution, but one that itself depends on the queue-completion assumptions Section 5 shows to be historically generous.
7. Co-location: The Escape Valve and Its Precedent
7.1 The Susquehanna proceeding
The cleanest way to avoid a congested transmission network is not to use it — the logic of co-location, in which a large load is sited at a generator and served directly. Its defining test was the arrangement between Talen Energy and Amazon at the 2.5 GW Susquehanna nuclear plant in Pennsylvania. In November 2024, FERC, by a 2–1 vote, rejected an amended interconnection service agreement that would have increased behind-the-meter supply to a co-located Amazon Web Services facility from 300 MW to 480 MW. The majority held that PJM had not met the Order No. 2003 burden of justifying a non-conforming agreement; the chairman dissented, characterizing the configuration as "first-of-a-kind" and warranting approval (Utility Dive, 2024). Talen sought review in the Third Circuit.
7.2 Net versus gross: the analytical crux
Co-location's central technical dispute concerns the basis on which a hybrid load-plus-generation facility is studied. Developers argue for a net basis — measuring grid impact by net injections and withdrawals — on the ground that on-site generation reduces system burden. Utilities and planners insist on a gross basis, arguing the grid must withstand contingencies when on-site generation fails, and that net accounting shifts reliability risk and cost onto other ratepayers (CSIS, 2025). The December 2025 order's requirement that co-located loads pay for Regulation and Black Start on a gross basis is a partial resolution in favor of the conservative view. The stakes are not trivial: an analysis of PJM territory finds that traditional firm interconnection of new large load imposes roughly $764 million per gigawatt in system supply costs, whereas a flexible "bring-your-own-capacity" approach — accepting curtailment of only 40–70 hours per year while maintaining grid availability above 99% — can reach full operation in about two years, three to five years faster than firm service (Camus Energy, via Institute for Progress, 2026).
7.3 The restructured template
Market behavior is instructive. In June 2025, Talen and Amazon restructured their arrangement into a long-dated power-purchase agreement — reported at roughly $18 billion over 17 years for up to 1,920 MW — delivered front-of-the-meter, through the grid rather than behind it. The restructuring preserved the economic substance while conforming to FERC's reliability and cost-allocation concerns, and the December 2025 order generalized the lesson by building standardized service options. RM26-4-000 carries that template to the national level. The episode illustrates both the appeal of co-location and the regulatory friction it must still navigate — friction that the reform is, genuinely, designed to reduce.
8. Cost Allocation: The Distributional Heart of the Reform
8.1 Cost causation versus beneficiary pays
Beneath the engineering lies a distributional question with a substantial economics literature. Two principles compete. Cost causation assigns upgrade costs to the party whose connection triggers them — the basis for participant funding, and the position defended on both legal and efficiency grounds by, among others, the R Street Institute (2024) and formalized in recent scholarship (Ribeiro et al., 2025). Beneficiary pays assigns costs in proportion to benefits received, recognizing that transmission, once built, lowers congestion and improves reliability for all users; it is the principle embodied in FERC's Order No. 1920 (2024), which requires that costs be allocated to beneficiaries "at least roughly commensurate with estimated benefits," subject to a benefit-to-cost threshold no greater than 1.25 to 1.
8.2 The efficiency case and its limits
Participant funding has a clean efficiency rationale: it confronts the connecting load with the social cost of its location decision, sharpens siting incentives toward unconstrained areas, and protects existing ratepayers from subsidizing private expansion. Yet even its proponents acknowledge the logic is incomplete. Transmission exhibits positive externalities and economies of scale; charging the first mover the full, lumpy cost of an upgrade that subsequently benefits many can deter socially valuable investment (CSIS, 2025). And the equity incidence is uneven: capital-intensive industrial loads — an electric-arc-furnace steel mill, for instance — "often cannot" absorb full network-upgrade costs in the way a hyperscaler can (CSIS, 2025), a concern the industrial commenters pressed directly (IECA/ELCON, 2025). FERC's Order No. 1920, with its beneficiary-pays orientation, sits in tension with a strict participant-pays model and frames the unresolved question.
8.3 Incidence: the cross-subsidy is already running
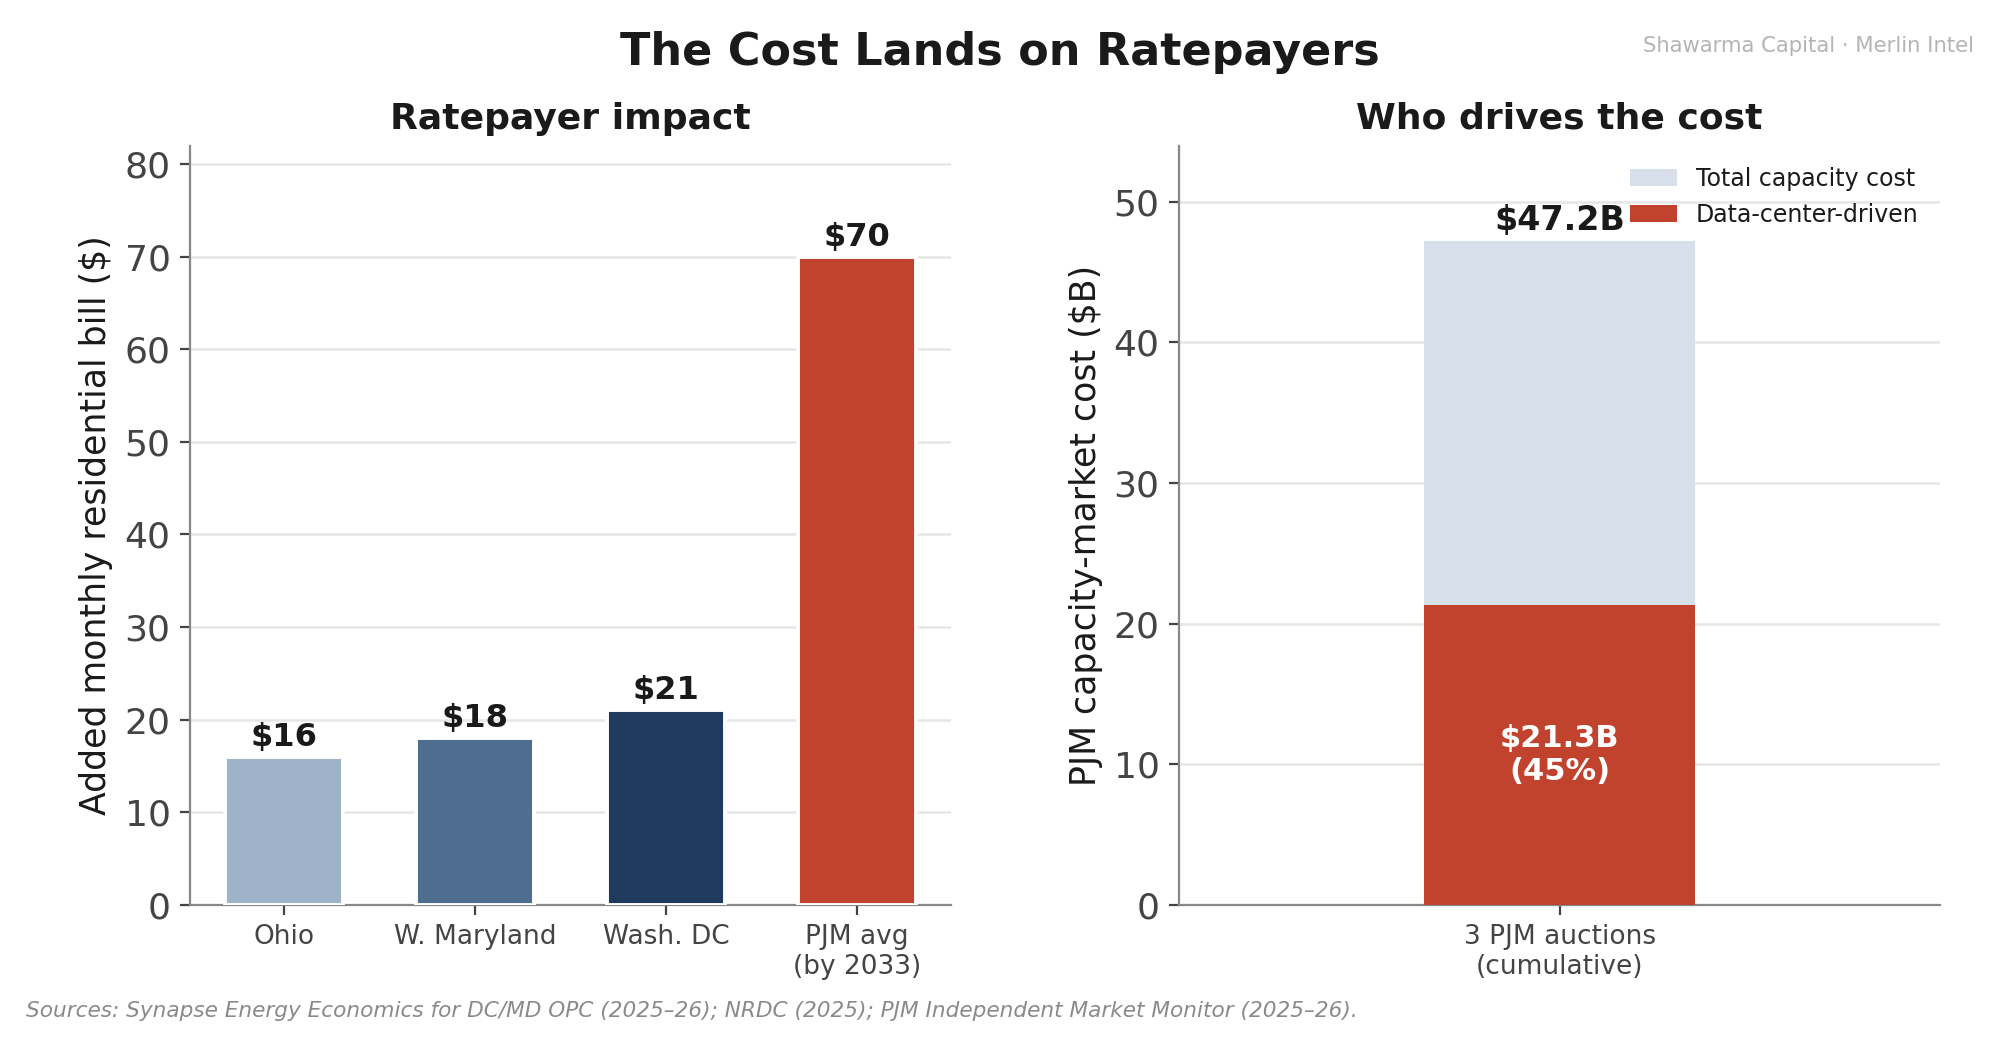
The most important empirical point is that the distributional stakes are not hypothetical. The cross-subsidy is already operating at multi-billion-dollar scale. PJM's Independent Market Monitor attributes 63% of the 2025/26 capacity-price increase — about $9.3 billion — to data-center load, and finds that across the last three base auctions data-center forecast load above existing levels accounted for $21.3 billion, or 45%, of the $47.2 billion in cleared capacity costs (Monitoring Analytics, 2025–2026). Separately, the Union of Concerned Scientists documents $4.4 billion in 2024-approved local transmission projects serving data centers — more than 150 projects across seven states, with nearly $2.2 billion in Virginia alone — socialized across all ratepayers (UCS, 2025). Because more than 90% of U.S. transmission investment is currently categorized as "reliability-driven" and rolled into broad zonal rates (Brattle Group, 2024), the existing structure provides almost no mechanism to trace these costs back to the load that triggered them.
8.4 The household bill
The incidence reaches households directly. Synapse Energy Economics, in studies commissioned by state consumer advocates, documents capacity-driven monthly bill increases of approximately $21 in Washington, D.C., $18 in western Maryland, and $16 in Ohio, beginning in June 2025 (Synapse, 2025), and projects that PJM residential bills could rise nearly 60% by 2036–2040 absent interconnection reform (Synapse / Evergreen Action, 2025). The NRDC estimates cumulative data-center-driven capacity costs of $100–163 billion through 2033 — about $70 per month for the average PJM household — with Dominion-zone ratepayers facing capacity fees 65% above the PJM average (NRDC, 2025). A White House "ratepayer protection pledge" signed by hyperscalers in March 2026 carries no enforcement mechanism; absent a binding FERC rule, it is, as one analysis observes, legally unenforceable (Latitude Media, 2026). Cost allocation is therefore not a peripheral feature of the reform but its most consequential lever.
8.5 Compromise designs
A middle path is emerging in the comment record and at state commissions: large loads fund upgrades upfront but receive partial refunds or credits if their facilities later deliver system-wide benefits. Such designs attempt to preserve the incentive properties of participant funding while internalizing the positive externalities that pure cost causation ignores — a pragmatic reconciliation of the two principles that bracket the debate.
9. Generation Adequacy and the Equipment Supply Chain
If the binding constraint is physical, the supply chain is where the analysis must conclude. The evidence here is the strongest in the paper, and it is the reason the procedural reform cannot, on its own, move aggregate speed-to-power.
9.1 Gas turbines
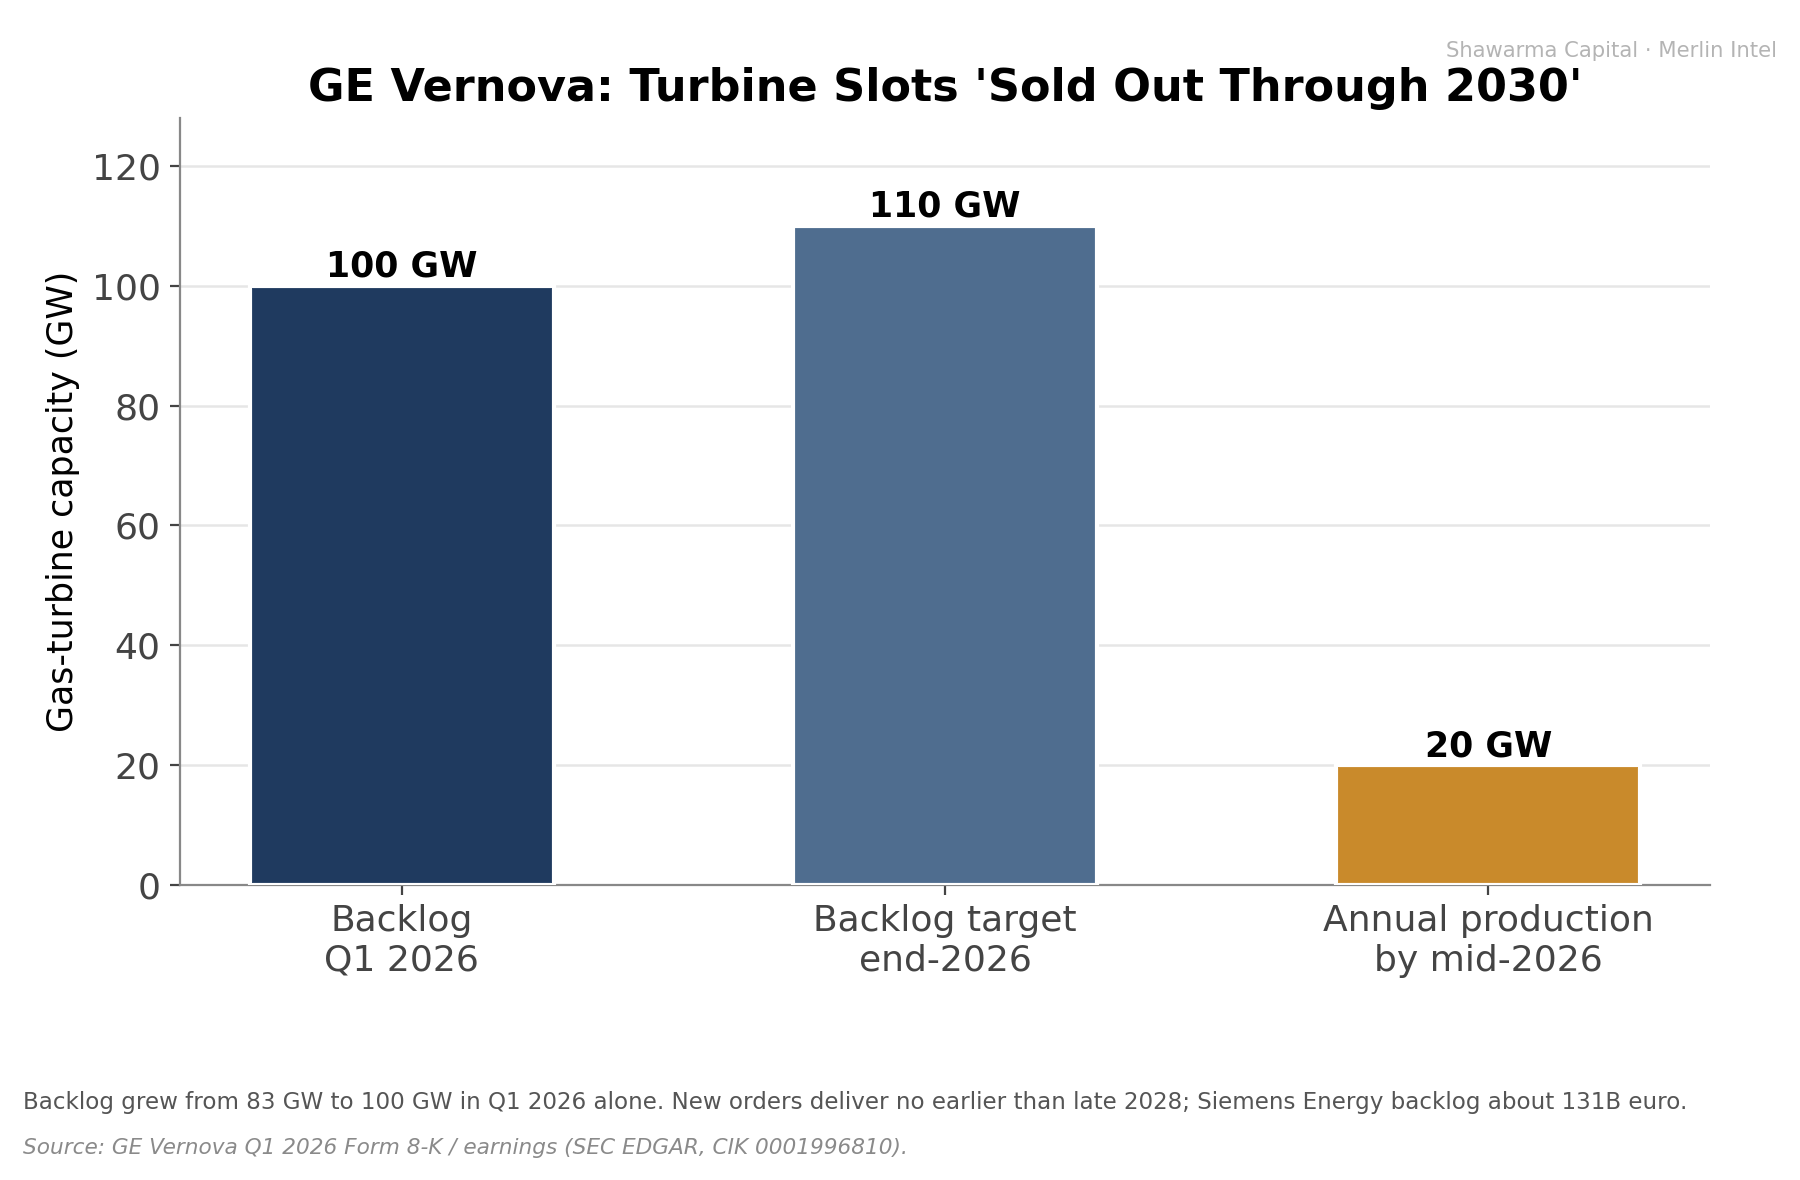
The fast-ramping gas capacity utilities would normally deploy to serve new load is effectively unavailable on the relevant horizon. GE Vernova's gas-power backlog grew from 83 GW to 100 GW in the first quarter of 2026 alone, with management guiding to at least 110 GW by year-end and stating that reservation slots will be "sold out through 2030" by the end of 2026 (GE Vernova Q1 2026 Form 8-K). New orders placed today are not deliverable until late 2028 at the earliest; Mitsubishi Power quotes 2028–2030; and Siemens Energy carries a record backlog of roughly €131 billion (about $148 billion), with three manufacturers serving more than 75% of projects under construction (RMI, 2025). S&P Global reports U.S. turbine wait times of as much as seven years, and procurement costs rising sharply — Duke Indiana's Cayuga project cleared at $2,340/kW, 36% above the prior year, a roughly $900 million overrun on a 1,476 MW facility (S&P Global, 2025).
9.2 Transformers and grain-oriented electrical steel
Transformers are the second binding constraint. Large power transformer lead times average roughly 120–160 weeks (about 2.5–3 years), with specialized units reaching 210 weeks; the U.S. Department of Energy's 2024 Report to Congress cites commonly quoted lead times of 36 months and maxima of 60 (DOE, 2024). Generator step-up transformers average about 144 weeks. The IEA reports that procurement now takes up to four years — double the 2021 baseline — with transformer prices up roughly 75% since 2019 and DC-cable lead times beyond five years (IEA, 2025). Demand for high-voltage transformers has risen 116% since 2019, and for generator step-up units 274%. The upstream chokepoint is acute: transformer cores require grain-oriented electrical steel, of which the United States has a single domestic producer (Cleveland-Cliffs), so that more than 80% of new large power transformers are imported (DOE, 2024; NIAC, 2024). Within the transformer itself, high-voltage bushings and on-load tap changers — specialized, application-certified components served by few qualified suppliers — are the most consistent build-schedule bottlenecks (IEA, 2025).
9.3 The systemic consequence and the price feedback
These constraints aggregate into a build-out that lags its own demand signal. Industry analyses estimate that more than half of planned U.S. data centers may be delayed or cancelled for lack of electrical equipment — of roughly 12 GW expected to come online in the U.S. in 2026, only about one-third was under active construction, the remainder awaiting equipment with three-to-five-year delivery (trade synthesis, 2025–2026). Wood Mackenzie projects the U.S. data-center electrical-equipment market expanding from about $20 billion to $65 billion by 2030, a tripling that manufacturing capacity cannot match in time. The feedback into prices is direct: the Brattle Group's 2025 Cost of New Entry study for PJM found that the scarcity of turbines, transformers, and switchgear drove the cost of a new gas-fired plant 43–46% higher than in the prior study (Brattle, 2025) — which is precisely why the capacity market of Section 6 cleared where it did. The binding constraint, in short, is not capital: collective AI-infrastructure capital expenditure for 2026 exceeds $650 billion. It is energized megawatts.
9.4 New firm supply: nuclear, SMRs, and on-site gas
The fastest path to firm power has become bringing one's own. This takes three forms. Nuclear restarts and uprates — the Three Mile Island Unit 1 / Crane restart contracted to Microsoft; Palisades; Duane Arnold — add carbon-free firm capacity but on multi-year timelines. Small modular reactors remain years from first commercial megawatts. On-site gas, frequently aeroderivative units used as "bridge" generation, is presently the quickest deployable firm option and the principal beneficiary of the co-location reforms — though it, too, is gated by the turbine constraint of Section 9.1, and the IEA cautions that reliable on-site gas service requires overbuilding generation by 30–70% relative to demand, with an estimated 15–27 GW of on-site gas potentially serving U.S. data centers by 2030 (IEA, 2025).
10. Synthesis
10.1 For policy
The reform correctly identifies, and fills, a genuine institutional gap: the absence of a standardized large-load interconnection framework. But policymakers should hold realistic expectations about its effect on aggregate speed-to-power. Standardizing procedure will not, by itself, materially accelerate the rate at which firm load can be added while equipment and transmission constraints bind. The higher-leverage levers lie upstream — in transformer, turbine, and electrical-steel manufacturing capacity; in workforce; and in transmission permitting and construction — none of which is within the reform's reach. The reform is best understood as removing a real but secondary friction, and as setting the terms (through cost allocation) on which the binding constraints will be financed.
10.2 For reliability
By easing co-location and behind-the-meter pathways, the reform shifts part of the resource-adequacy question off the centrally-planned grid and onto private arrangements. This can accelerate individual projects, but it raises the net-versus-gross question of Section 7 at system scale, and it presumes a load flexibility that hyperscalers have been reluctant to provide in practice. The conservative, gross-basis treatment in the December 2025 order mitigates, but does not eliminate, the risk that planning models understate firm-capacity needs — a risk made concrete by the first RTO-wide capacity shortfall in PJM's history.
10.3 Economic incidence
The reform's most consequential effect is distributional. Participant funding would reallocate the cost of network upgrades from the general ratepayer base toward the connecting load — a shift with efficiency merits and real equity costs, and one whose final calibration (including any refund-for-shared-benefit mechanism) will determine the incidence of a sum already running into the tens of billions of dollars. Given that the cross-subsidy is already documented at $21.3 billion across three auctions and $4.4 billion in socialized transmission, the cost-allocation question — not the study-timeline question — is where the reform's stakes are highest.
11. Scenarios and Sensitivity
Base case. RM26-4 standardizes large-load interconnection and modestly compresses study timelines; co-location accelerates a meaningful minority of projects; equipment and transmission lead times keep aggregate speed-to-power gated through the late 2020s. PJM capacity prices remain at or near the cap; behind-the-meter generation proliferates; the cross-subsidy debate intensifies as bills rise.
Upside. Aggressive participant funding plus standardized co-location catalyzes faster private build-out of generation alongside load, easing the network-upgrade burden; manufacturing capacity for turbines and transformers expands on the strength of multi-year backlogs; the supply curve bends by approximately 2028–2029, and capacity prices ease as committed supply arrives.
Downside — and it is well-supported. A demand air-pocket. Goldman Sachs estimates that only about 60% of announced data-center capacity will materialize on schedule in the near term, falling toward 50% over two years, and frames the resulting stranded-asset risk explicitly (Goldman Sachs, 2025); the IEA independently flags that around 20% of planned projects are at risk of delay (IEA, 2025); and PJM's own methodology tightening concedes that announced load overstates probable load. If AI capital expenditure moderates, or if efficiency gains compress per-query energy intensity faster than base cases assume, the committed generation, equipment orders, and participant-funded upgrades would face a softer demand signal, concentrating stranded-cost risk. Rhodium's high-growth scenario, conversely, places data centers at 14% of U.S. power by 2030 and raises system costs 13–15% by 2035 (Rhodium, 2026) — the band of outcomes is wide in both directions.
What would change the conclusion. The thesis — that procedure is not the binding constraint — would weaken if (i) equipment lead times compressed sharply through manufacturing expansion; (ii) co-location and behind-the-meter generation scaled fast enough to bypass the transmission constraint for a large share of load; or (iii) the procedural stage proved, on better project-level data, to occupy a larger share of the critical path than Table 2 assumes. Each is a testable empirical question, and each is the right place to look for evidence against the argument advanced here.
12. Limitations and Future Research
The stage durations of Table 2 are representative ranges, not point estimates; they vary by region, voltage class, and equipment type, and a more rigorous treatment would estimate them econometrically from project-level data. The capacity-price counterfactuals depend on the price-collar settlement and on PJM's evolving load-counting methodology. The precise legal instrument issued on June 18, 2026 governs the reform's ultimate effect, and compliance litigation — together with the unresolved Section 201(b) jurisdictional question — will shape implementation for years. Promising avenues for further research include: project-level survival analysis of large-load interconnection requests; estimation of the cross-elasticity between capacity prices and behind-the-meter adoption; welfare modeling of alternative cost-allocation designs, including refund-for-benefit mechanisms; and empirical measurement of realized large-load flexibility against the assumptions embedded in expedited-study eligibility.
13. Conclusion
FERC's large-load interconnection reform is sound policy directed at a real institutional gap, and it arrives at a moment of genuine urgency: PJM's capacity market has cleared at its cap three years running and, for the first time in its history, has cleared below the reliability requirement. But the reform should be understood for what it is — the relaxation of the shortest constraint in the speed-to-power system. The binding constraints are physical and financial: gas-turbine slots sold out to 2030, transformer lead times of two-to-four years resting on a single domestic source of electrical steel, a capacity market whose price cap suppresses the very signal needed to close a 6,623 MW shortfall, and tens of billions of dollars in cross-subsidy whose allocation the reform must still decide. The procedural fast-track is a necessary permission slip. It is not, by itself, the power.
References
American Bar Association, Infrastructure & Regulated Industries. (2026). The Jurisdictional Collision over Large Loads and Data Center Interconnection. Spring 2026.
Avalon Energy Services. (2026). PJM 2027/2028 Base Residual Auction Clears at Price Cap.
Baker Botts LLP. (2025). FERC Issues Order Providing Guidance for "Co-locating" Power Plants with Data Centers within PJM.
Brattle Group / Pfeifenberger, J. (2024). Transmission Cost Allocation for Order 1920 Compliance. NARUC–NASEO–DOE Webinar, Dec. 6, 2024.
Brattle Group. (2025). 2025 Cost of New Entry (CONE) Report for PJM. April 2025.
Center for Strategic and International Studies (Yang, A., Cai, R., Majkut, J., Zacarias, M.). (2025). What's at Stake in FERC's Large Load Proposal? Dec. 9, 2025.
Federal Energy Regulatory Commission. Interconnection of Large Loads to the Interstate Transmission System, Docket No. RM26-4-000 (ANOPR transmitted Oct. 27, 2025; Order Regarding Intent to Act, Apr. 16, 2026; action June 18, 2026). Order No. 2003 (2003); Order No. 2023 (2023); Order No. 1920 / 1920-A (2024).
Federal Energy Regulatory Commission. PJM Interconnection, L.L.C., 193 FERC ¶ 61,217 (Dec. 18, 2025); Fact Sheet and Commissioner concurrences (Chang, Rosner).
Goldman Sachs Research / GS SUSTAIN. (2025). Data Center Power Demand: The 6 Ps Driving Growth and Constraints; and US Data Center Power Demand Projected to Double by 2027.
Gorman, W., Mulvaney Kemp, J., Rand, J., Seel, J., Wiser, R., et al. (2024). Grid connection barriers to renewable energy deployment in the United States. Joule 9(2). DOI: 10.1016/j.joule.2024.11.008.
Grid Strategies LLC. (2026). Review of NERC's 2025 Long-Term Reliability Assessment.
Institute for Progress. (2026). Fast and Secure Grid Interconnection for American AI Leadership (citing Camus Energy PJM study).
International Energy Agency. (2025). Energy and AI (World Energy Outlook Special Report); Building the Future Transmission Grid. (2026). Electricity 2026.
Lawrence Berkeley National Laboratory (Rand, J., et al.). (2025). Queued Up: 2025 Edition. OSTI:3008763.
Lawrence Berkeley National Laboratory (Shehabi, A., et al.). (2024). 2024 United States Data Center Energy Usage Report.
Lawrence Berkeley National Laboratory. (2025). Large Load Literature Review, December 2025 Update; and Electricity Rate Designs for Large Loads (Jan. 2025).
Mayer Brown LLP. (2025). FERC Large-Load Interconnection Preliminary Rulemaking: Key Takeaways. McGuireWoods LLP. (2025). FERC Establishes Proceeding to Consider DOE Directive.
Monitoring Analytics, LLC (PJM Independent Market Monitor). (2025–2026). State of the Market Report for PJM — 2025 (Mar. 12, 2026); Q3 2025 State of the Market; IMM Comment, Docket RM26-4-000 (Nov. 25, 2025); IMM Complaint re Data Center Loads.
Morgan Stanley Research. (2025–2026). Powering AI: Markets Race to Invest in AI Energy Solutions.
North American Electric Reliability Corporation. (2026). 2025 Long-Term Reliability Assessment.
NRDC (Rutigliano, T.). (2025). PJM Board to Decide on Higher Bills for 67 Million Americans Due to Data Centers.
NIAC / CISA. (2024). Addressing the Critical Shortage of Power Transformers. (Draft, June 2024.)
PJM Interconnection. (2024–2025). Base Residual Auction Reports (2025/26, 2026/27, 2027/28); 2025 Long-Term Load Forecast; Regional Transmission Expansion Plan.
R Street Institute (Chandler, K.). (2024). Cost-Causation Is No Cause for Concern; and Initial Comments, Docket RM26-4-000 (2025).
Rhodium Group (Carter, T., King, B., Larsen, J., van Brummen, A., Kolus, H.). (2026). The Impacts of Rising Electricity Demand from Data Centers on US Energy and Emissions. Apr. 7, 2026.
Ribeiro, L., Street, A., Arroyo, J. M., Moreno, R. (2025). A Causation-Based Framework for Pricing and Cost Allocation of Energy, Reserves, and Transmission. arXiv:2505.24159.
RMI (Cohen, J., Fitch, T., Shwisberg, L.). (2025). Gas Turbine Supply Constraints Threaten Grid Reliability. June 18, 2025.
S&P Global Commodity Insights. (2025). US Gas-Fired Turbine Wait Times as Much as Seven Years; Costs Up Sharply.
Synapse Energy Economics. (2025). For DC Office of People's Counsel, Drivers of PJM's Capacity Market Price Surge; for MD Office of People's Counsel (2026); for Evergreen Action, Tackling the PJM Electricity Cost Crisis.
Union of Concerned Scientists (Jacobs, M.). (2025). Connection Costs Loophole Costs Customers Over $4 Billion.
U.S. Department of Energy. (2024). Large Power Transformer Resilience Report to Congress.
Utility Dive; American Nuclear Society. (2024–2025). Talen–Amazon Susquehanna interconnection coverage. GE Vernova Inc., Form 8-K / Q1 2026 (SEC EDGAR, CIK 0001996810).
Appendix A. Glossary
ANOPR — Advance Notice of Proposed Rulemaking. BRA — Base Residual Auction (PJM's forward capacity auction). BTMG — behind-the-meter generation. CONE — Cost of New Entry. Co-location — siting a large load at a generator to be served directly. FRR — Fixed Resource Requirement (an alternative to RPM participation). GOES — grain-oriented electrical steel. ISA — Interconnection Service Agreement. LDA — Locational Deliverability Area. LMP — Locational Marginal Price. RML/ARM — Reference Margin Level / Anticipated Reserve Margin. RPM — Reliability Pricing Model (PJM's capacity market). RTO/ISO — Regional Transmission Organization / Independent System Operator. SSR/RMR — System Support Resource / Reliability-Must-Run. UCAP — Unforced Capacity.
Appendix B. Methodology note
Quantitative claims are drawn from primary sources (FERC dockets and orders, PJM auction and load reports, the PJM Independent Market Monitor, NERC, LBNL, DOE, and equipment-manufacturer disclosures), peer-reviewed literature (Joule; arXiv), and reputable institutional research (Brattle, IEA, EPRI, Goldman Sachs, Morgan Stanley, Rhodium, RMI, Synapse). Where figures vary across sources (for example, data-center demand projections), ranges are reported rather than point estimates. Critical-path stage durations (Table 2) are representative syntheses intended to convey relative magnitude, and should be read as ordinal rather than cardinal.
This paper is for informational and educational purposes only and does not constitute investment, legal, or engineering advice.
so which stocks win